These mobile gaming revenue statistics show how large the category has become, how mobile compares with PC and console, and how app-store in-app purchase trends have shifted after the post-pandemic cooldown.
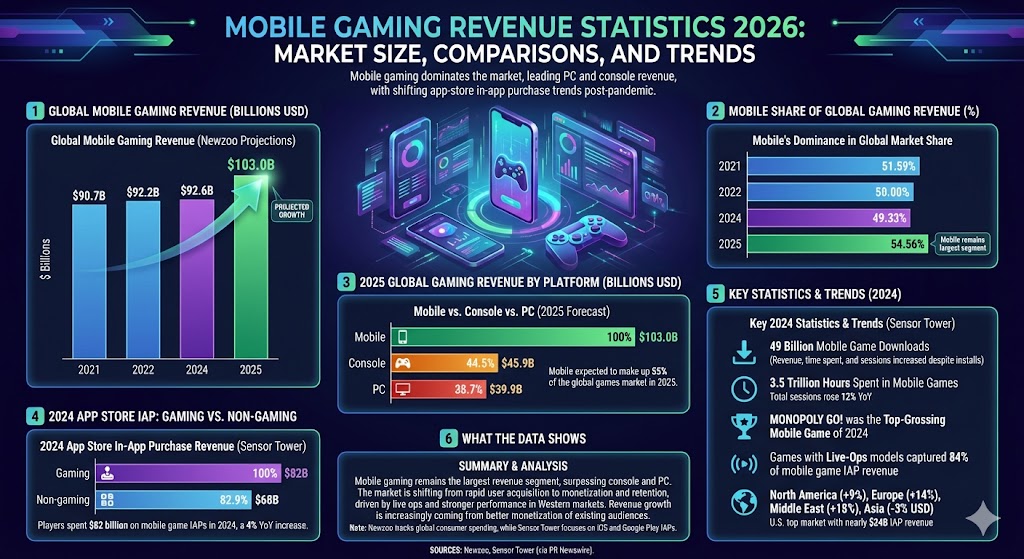
Max = $103.0B. Widths: Mobile 100.00%, Console 44.56%, PC 38.74%
2024 App Store IAP: Gaming vs. Non-Gaming
Label
Bar
Value
Gaming
$82B
Non-gaming
$68B
Max = $82B. Widths: Gaming 100.00%, Non-gaming 82.93%
What These Mobile Gaming Revenue Statistics Show
Mobile gaming is still the largest revenue segment in games, but the market is no longer growing at the pandemic-era pace. Newzoo’s numbers show mobile remaining ahead of both console and PC, while Sensor Tower’s app-store data shows that monetization recovered in 2024 even as installs fell.
That combination matters. The current mobile gaming market is being driven less by sheer download volume and more by retention, live ops, higher payer value, and stronger performance in Western markets. In other words, revenue growth is increasingly coming from better monetization of existing audiences rather than from rapid user acquisition alone.
It is also important to keep methodology in mind. Newzoo’s figures track global consumer spending across the games market, while Sensor Tower’s mobile gaming figures cited here refer to iOS and Google Play in-app purchases. Those measurements are both useful, but they are not interchangeable totals.
Sources
Newzoo, Global Games Market to Generate $175.8 Billion in 2021, May 2021
Newzoo, The Games Market in 2022: The Year in Numbers, December 2022
Newzoo, The Global Games Market Will Generate $187.7 Billion in 2024, August 2024
Newzoo, Global Games Market to Hit $189 Billion in 2025 as Growth Steadies, September 2025
Sensor Tower, State of Mobile Gaming 2025, March 2025
Sensor Tower via PR Newswire, Mobile Gaming Rebounds in 2024 as Player Engagement and Spending Reach New Highs, March 2025
Sensor Tower, 2025 State of Mobile: Consumers’ $150 Billion Spent on Mobile Highlights, January 2025
Jumpstart your child's fascination with geology with these 10 rock collecting kits, perfect for sparking curiosity and adventure—discover the best options inside!
Navigate through the top 10 inflatable obstacle courses that guarantee excitement and adventure—discover which ones will transform your backyard into a thrilling playground!